 In our continuing coverage of the Gigabyte Z77X-UD5H WB we are moving into the performance side of things. Here is where it becomes difficult to differentiate between companies. The problem is that if you are testing Z77 Express based motherboards you are testing very similar platforms. It is only when you start adding in features to the mix that they separate. So the big deal here is how well do these products perform when you throw in all the advertised features (or at least as many as will work at once)? This is what we try to do with our performances testing. In our
Section II - Performance Tests, Synthetic
In this section of testing we cover the synthetics. These are tests that run a scripted sequence of internal APIs or that use another installed application to perform a series of scripted events. They are great in that they can provide reproducible results across various platforms. On the down side, synthetic tests can be fooled with driver tweaks and optimizations. In some cases it is necessary to rename the .exe file to something generic to discover if this is the case. In any event when this is needed (when a test shows a drastic difference in performance over the renamed exe) we will note this and show both results for comparison.
PCMark7 -
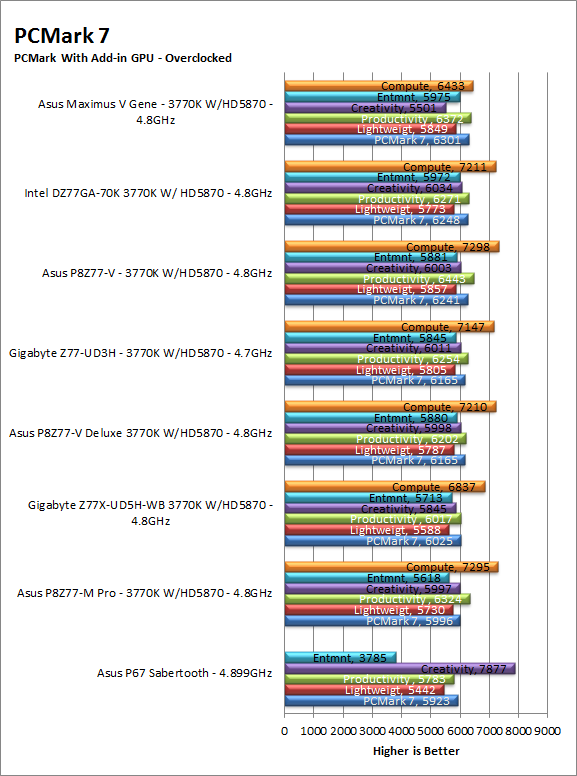
PCMark7 is the latest general performance test from FutureMark. As each generation of this benchmark has evolved and developed we have watched them add more and more realistic tests to this suite. With this generation we find more media tests, (audio and video transcoding) moving of large files, multiple web page rendering, and much more (the even added DX10 gaming). We use the Overall Performance and Common Usage suites in our testing.
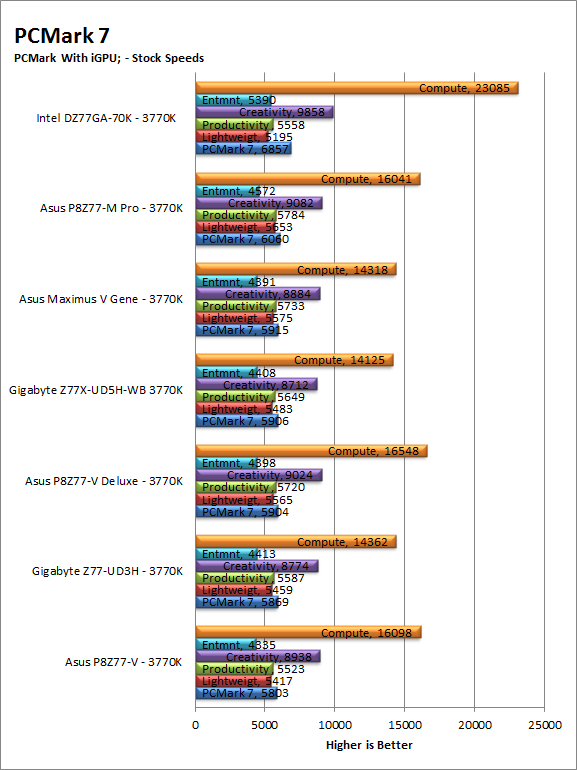
| PCMark7 iGPU Stock | PCMark7 iGPU Overclocked |
 |
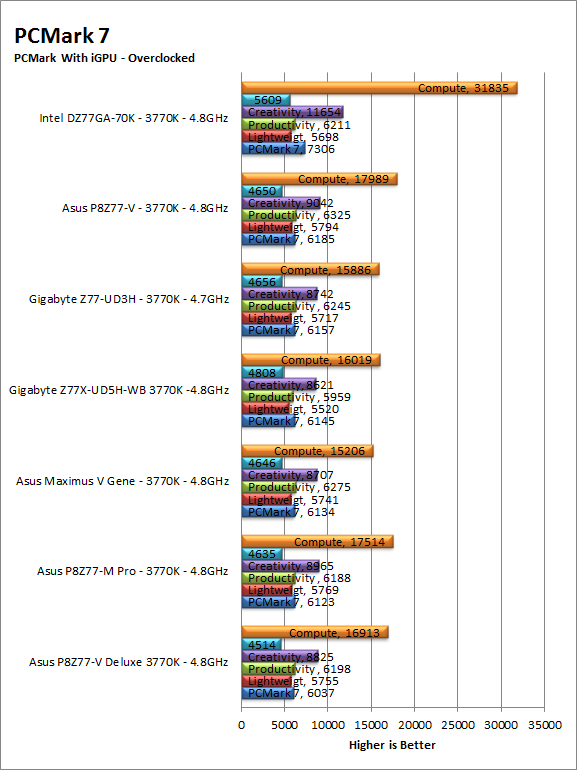 |
For PCMark7 we again found the Z77X-UD5H WiFi in the middle of the pack (or right around there) we were expecting a little more performance here, but as many of these tests are HDD reliant we were not overly surprised. Still the delta between the systems is very close so you would still get a good board here and it is unlikely that you would notice the performance difference unless you were trying to run multiple applications that required the HDD and Memory subsystems at the same time.
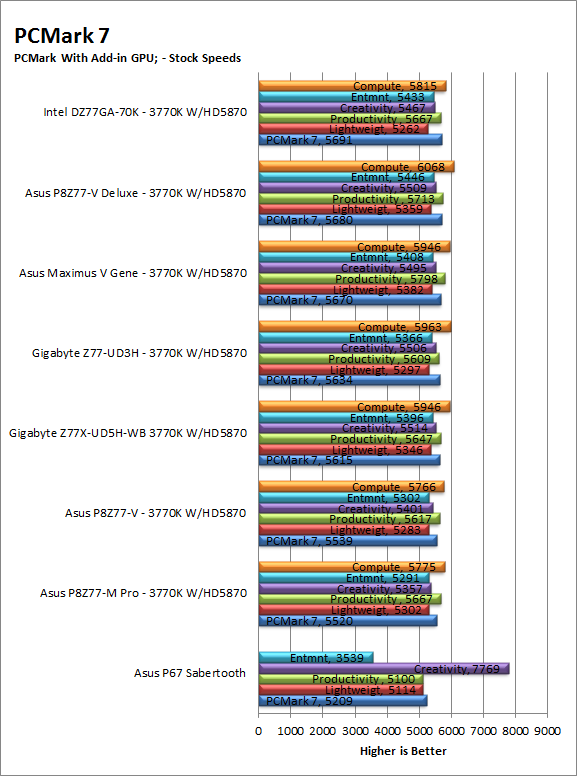
| PCMark7 Add-in GPU Stock | PCMark7 Add-in GPU Overclocked |
 |
 |
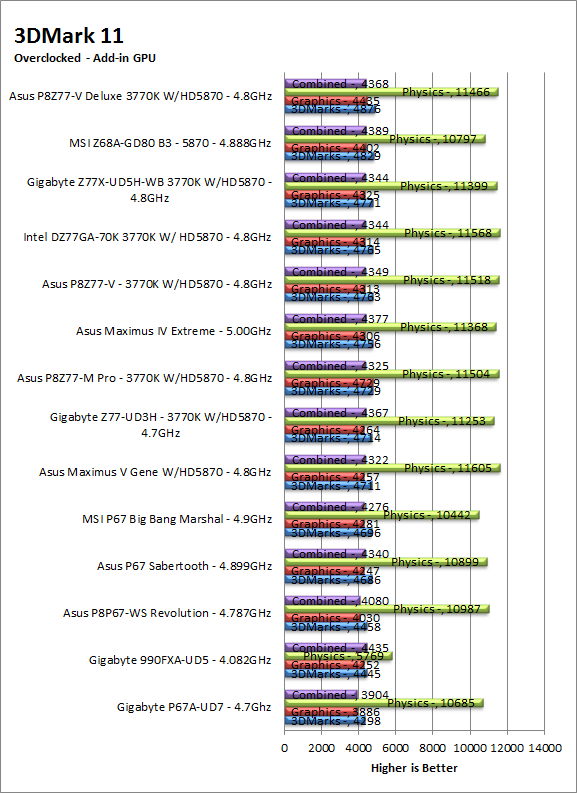
3DMark 11 -
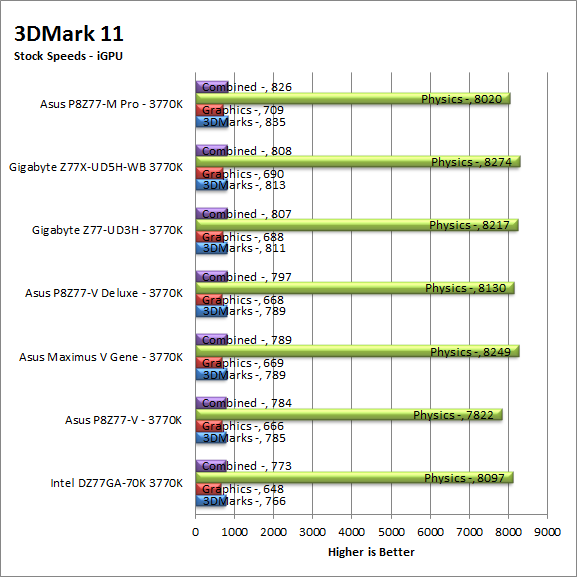
3DMark 11 is the other Futuremark test that we run on our motherboards. This test simulates the typical tasks that a GPU (and system) would have to perform to provide you with a good gaming experience. It is based on the DX9, DX10 and DX11 engines but can only be installed on Windows Vista or later. The suite of tests covers DX9, DX10, and of course DX11 rendering; it also covers AI computations and physics. That’s right I said Physics the latest version of 3DMark uses a Havok physics engine. This removes the advantage that nVidia had with 3DMark Vantage.
| 3DMark11 iGPU Stock | 3DMark11 iGPU Overclocked |
 |
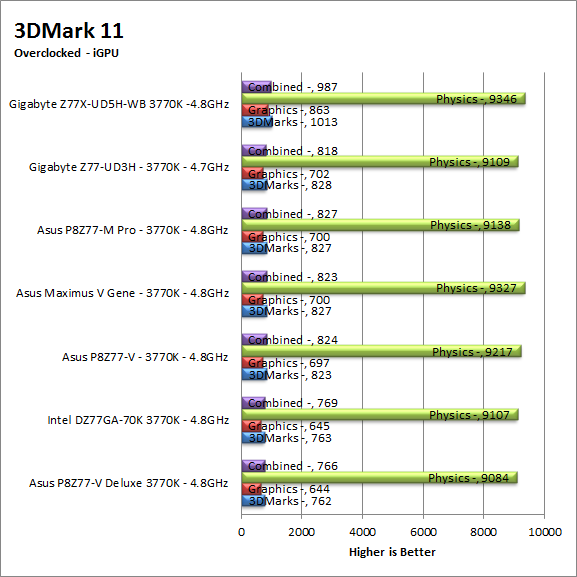 |
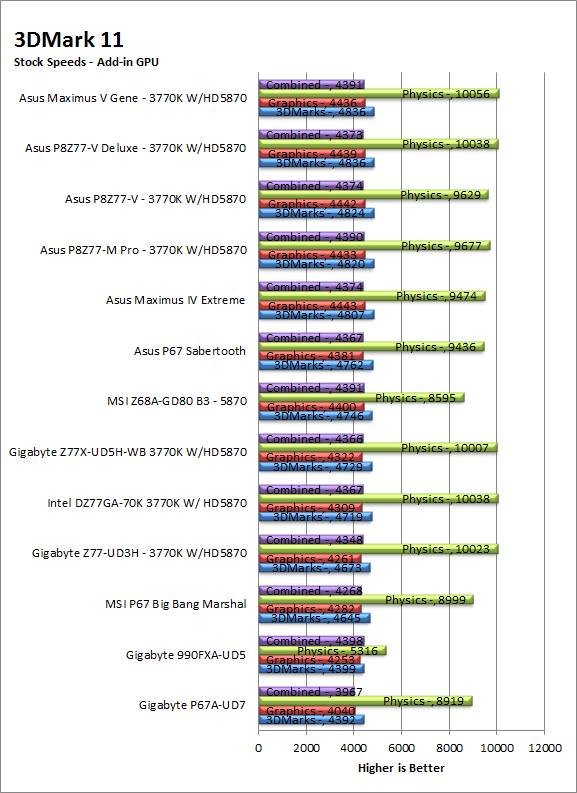
For 3DMark11 the Gigabyte Z77X-UD5H WiFi was once again around the middle of the pack… that is with an add-in GPU. Surprisingly with the iGPU in the Core i7 3770k it was right at the top and had a maximum overclock of 1.5GHz on the GMA 4000. We were more than a little surprised by this but as we always say, 3DMark11 is a good starting point, but it is not the same as real gaming.
| 3DMark11 Add-in GPU Stock | 3DMark11 Add-in GPu Overclocked |
 |
 |
HyperPi 0.99b -
HyperPi is a front end application that allows you to easily run multiple instances of the SuperPi application. SuperPi, for those that are not familiar with it, is an application that measures the time it takes to calculate the number Pi out to as many as 32 million places. This calculation is then checked and run multiple times (up to 24 for a 32M run). This test stresses the CPU, Memory and HDD as data is handed off between the three. If there is a weak link, HyperPi will show it. For our testing we run the 32M test on as many cores (and threads) as the CPU has available. The slowest CPU time is then recorded. The blue bars indicate the slowest time while the red indicate the fastest. 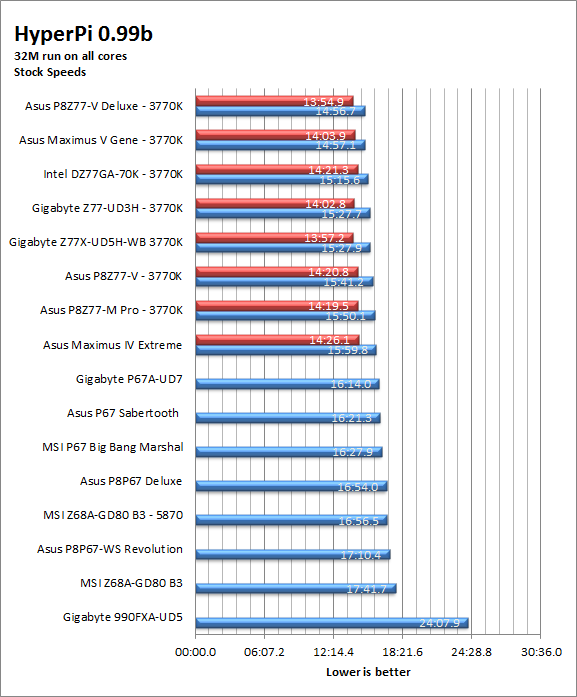 At stock speeds the UD5H WiFi does well, although it was not as fast as we would have hoped; this most likely due to the HDD performance that we saw (the SATA 3.0 performance). We would also now expect to see rendering, and even transcoding be affected by this level of performance as they are all not much more than complex calculations which get buffered in memory and written back to the disk.
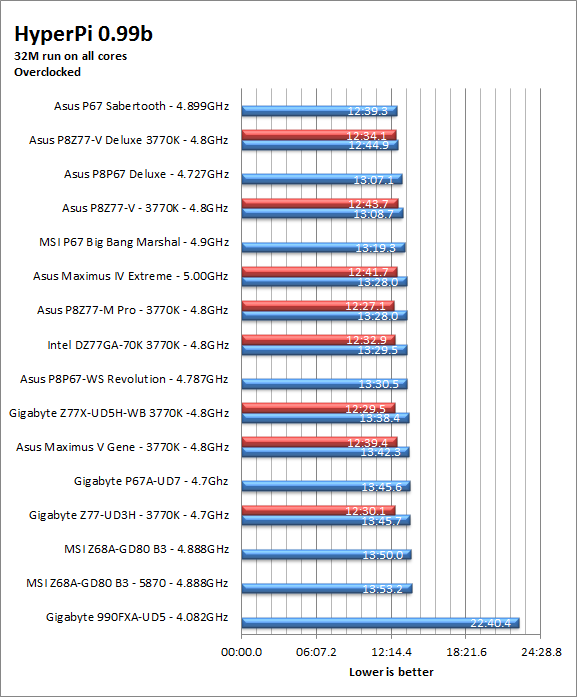
Cinebench R11.5 -
Cinebench R11.5 is the 11th release of Maxon’s rendering test. This test is based off of the Cinema 4D engine, which is one of the industry standard tools for digital animation. It is a powerful product with many different modules that can be “plugged” into it to increase its effectiveness. With Cinebench you get to see how your computer would do using this application. There are two tests; one tests the CPU’s ability to render an image across multiple cores or threads. The other tests your systems ability to handle OpenGL based rendering. 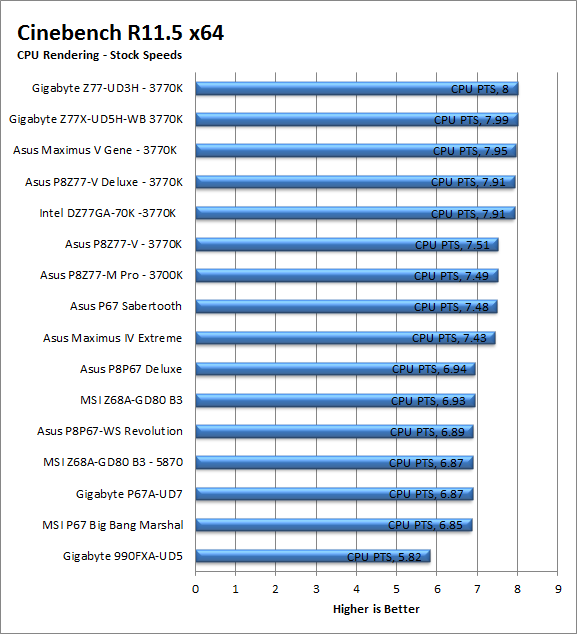
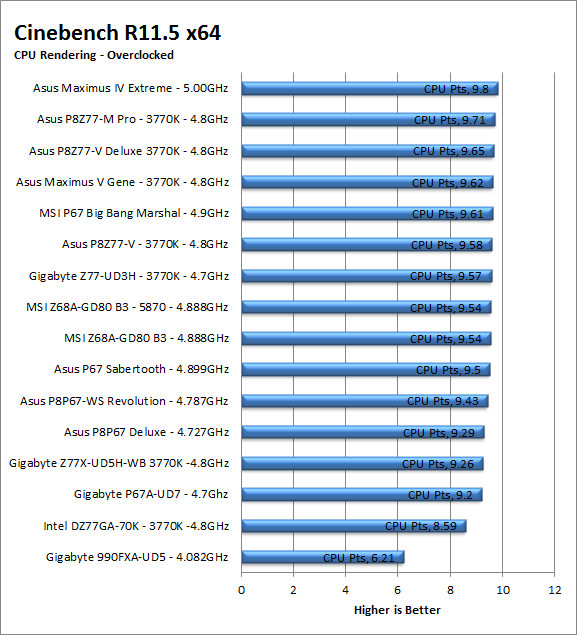
Both of Gigabyte’s Z77 boards do well with Cinebench at stock speeds for raw CPU rendering. However, when we start to push the CPU things drop off quite a bit and we find them toward the rear of the pack.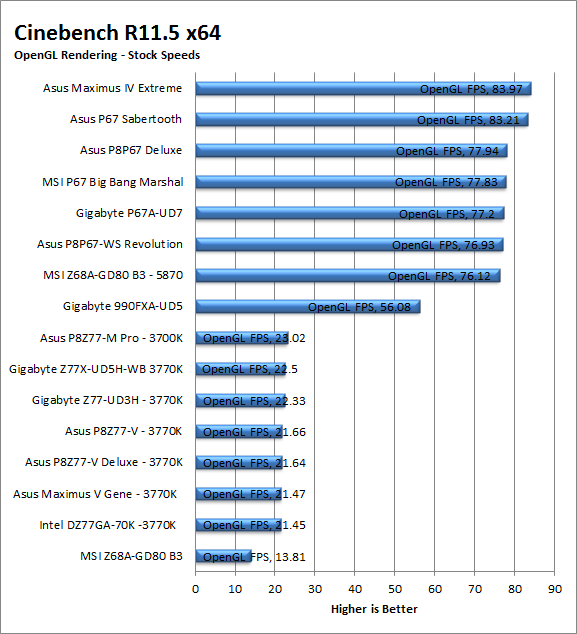
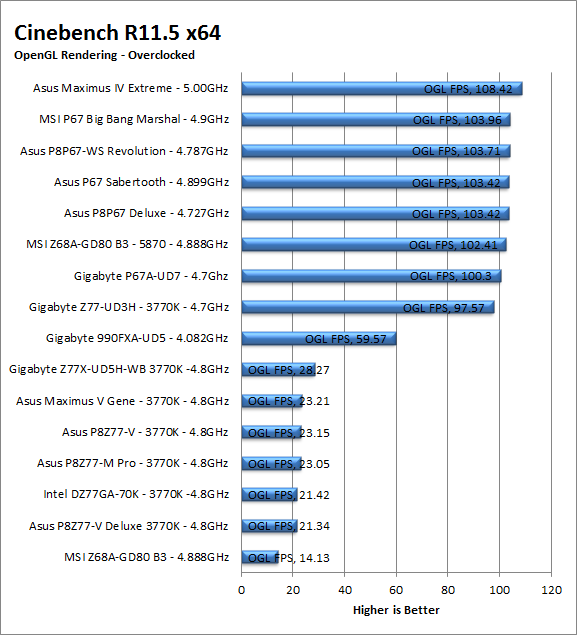
For OpenGL rendering the UD5H WiFi is right smack in the middle of things. So you should be able to get fairly decent performance out of the UD5H if you are looking to do some Maxon Cinema4D work, but it will not win you any records for performance.