 It is no secret that Intel pretty much owns the desktop market. This is not only in terms of performance per watt but in most cases performance Vs. Cost. Their chief rival AMD has had setback after setback which has hobbled their ability to compete. In fact is has gotten so bad that AMD has officially stated that they will no longer compete head to head with Intel in the desktop market (they will continue to make desktop CPUs but are moving more toward mobile CPUs). This is a shame and normally could mean that new products from Intel will slow down along with innovation (nothing makes you invent like real competition). However this has not stopped Intel from pushing out a new line up of Desktop CPUs that fall under the title of Ivy Bridge. Ivy Bridge is the Tick part of Intel’s Tick-Tock strategy where Sandy Bridge was the introduction of the microarchitecture and Ivy Bridge is the official die shrink from 32nm to 22nm. So let’s see what Ivy Bridge brings to the table in the form of the 3rd Generation Core i7 3770k.
Performance Part I
Synthetics -
For our performance testing we like to have a combination of synthetic and real-world testing. For Synthetics we have the usual bank of tests from FutureMark, Maxon, Sisoft, and HyperPi. These tests cover raw performance and potential; this side of testing brings out the basics of the CPU on its own while our real-world testing covers actual usage. So for the numbers crowd; let’s get started with two of the industry standards for benchmarking system and gaming performance.
FutureMark -
PCMark7 -
PCMark7 is the latest general performance test from FutureMark. As each generation of this benchmark has evolved and developed we have watched them add more and more realistic tests to this suite. With this generation we find more media tests, (audio and video transcoding) moving of large files, multiple web page rendering, and much more (the even added DX10 gaming). We use the Overall Performance and Common Usage suites in our testing.
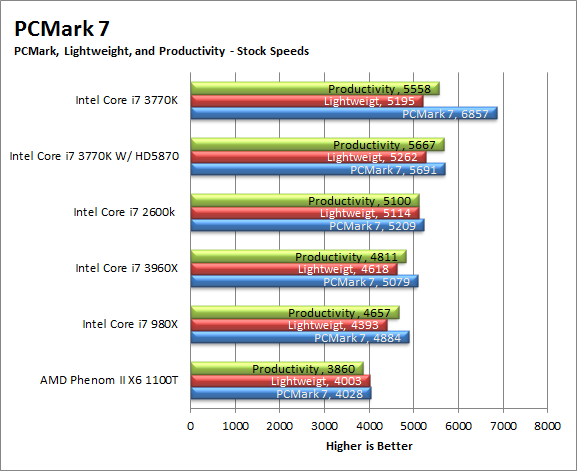
Under PCMark7 we get some interesting numbers as you can see with just the 3770K in the mix the PCMark7 scores are simply7 amazing. This is due to a massive 23085 compute score that we got running this test (we ran it about ten times to be sure). When your drop in a discrete GPU things change and the score drops by over 1100 points! This means that you are not getting the benefit of the GMA4000 (this was despite having the LucidLogix VirtuMVP installed and running).
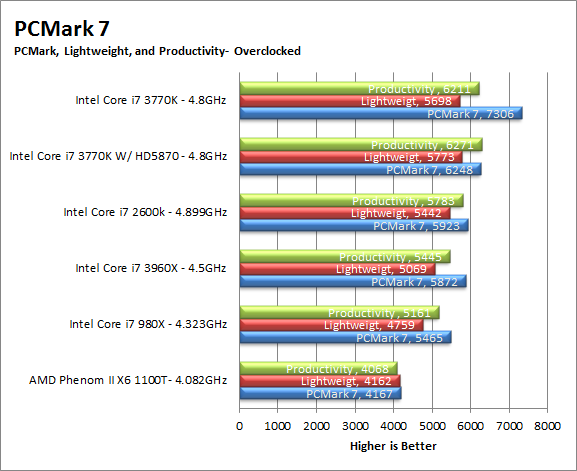
When we overclocked the system we saw the same type of result, the 3770K on its own had some very impressive compute and creativity scores (31835 and 11654 respectively), but these fell significantly when we dropped in a GPU.
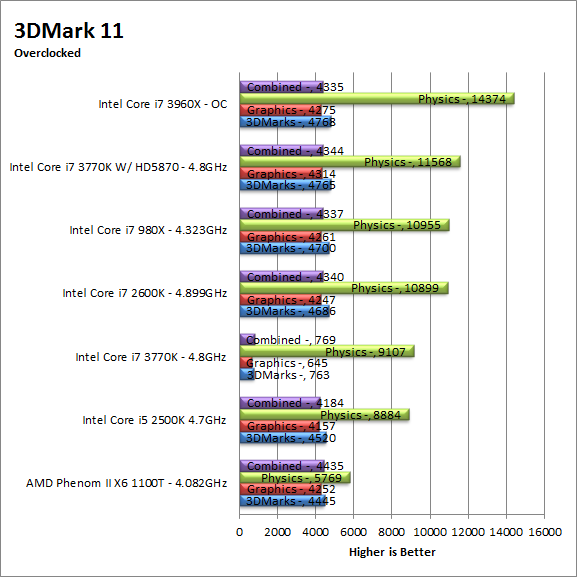
3DMark 11 -
3DMark 11 is the other Futuremark test that we run on our motherboards. This test simulates the typical tasks that a GPU (and system) would have to perform to provide you with a good gaming experience. It is based on the DX9, DX10 and DX11 engines but can only be installed on Windows Vista or later. The suite of tests covers DX9, DX10, and of course DX11 rendering; it also covers AI computations and physics. That’s right I said Physics the latest version of 3DMark uses a Havok physics engine. This removes the advantage that nVidia had with 3DMark Vantage.
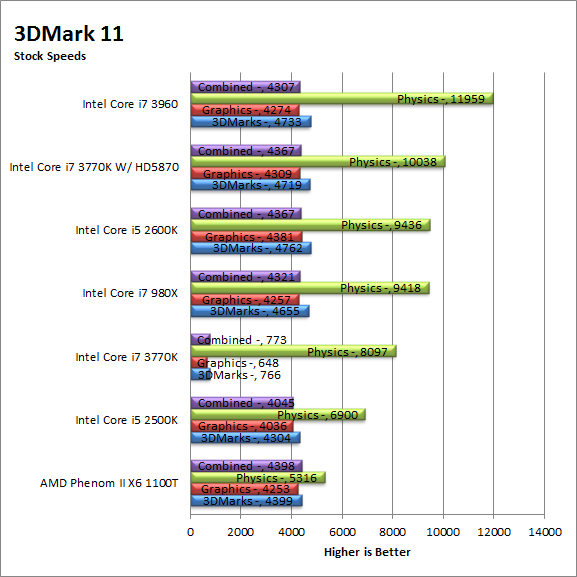
Here the numbers are much closer to what we would expect. The 3770K with the GMA4000 did well for an IGP but was no match for a full discrete GPU (and it is not meant to be either).
Sisoft Sandra -
Next we have Sisoft’s Sandra up on the board. Here we see the numbers that represent the raw potential of our CPUs. The tests include raw computational power for math functions, multi-media performance, the ability of the cores to communicate with each other and the CPU’s cryptographic capabilities.
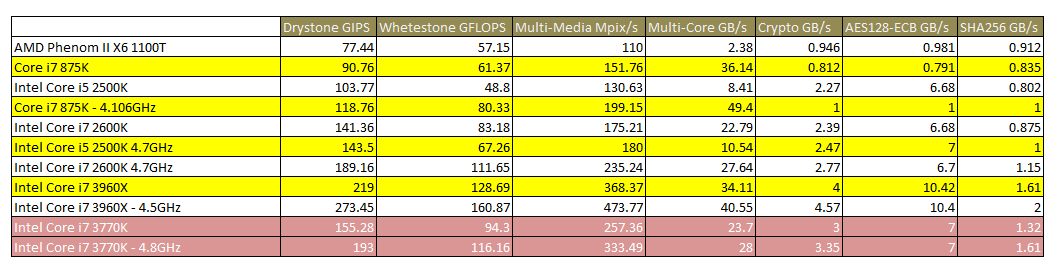
For our Sandra testing we saw that Ivy Bridge certainly has some improvements to the way it executes tasks. We see improvements across the board in some cases the stock performance equals or exceeds the overclocked performance of the older Sandy Bridge 2600K CPU.
HyperPi 0.99 -
HyperPi is a great test to find out how well a CPU can handle large amounts of math based information. With HyperPi you have a single instance of SuperPi Mod 1.3 running on each logical and physical core. This puts a great deal of stress on the CPU and also on the internal memory controller.
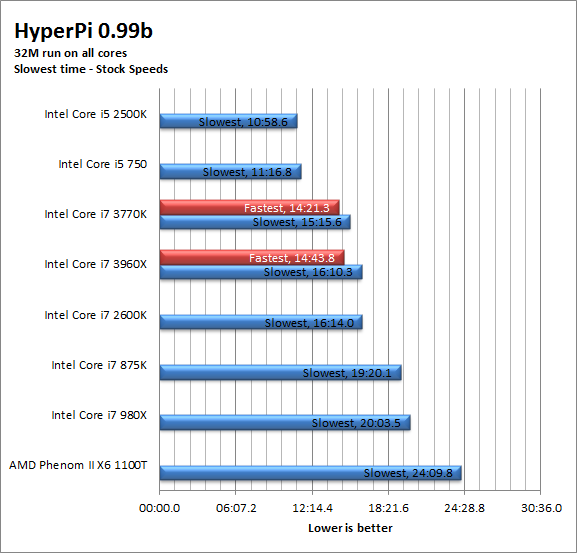
For our HyperPi testing we found something interesting. Usually HyperPi has a serious impact on the IMC (Internal Memory Controller) which means the higher the memory bandwidth the better the performance. On Sandy Bridge we saw a potential memory bandwidth of around 21GB/s. On Ivy Bridge this dropped down to around 16.5GB/s. Usually this would mean the HyperPi scores would drop, but this was not the case. The improved caching combined with some of the improvements in the way Ivy Bridge handles complex calculations gives it an almost one minute edge on Sandy Bridge at the same speeds.
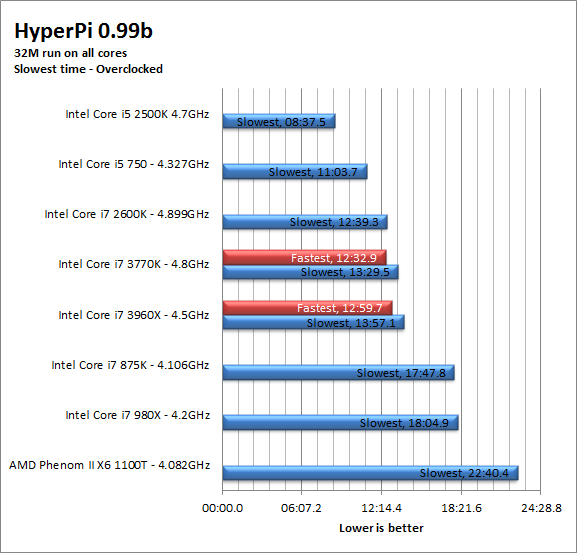
When overclocked Ivy Bridge loses some of its edge and we see the 2600K pull far out into the lead.
Photoshop CS5 -
Photoshop is an industry standard image manipulation application. It is great for not only editing photographs but also for creating original content. For out testing here we used the Driverheavn Photoshop script. This is a custom built action that puts a stock image through a series of filters and allows you to record the time each takes to run.
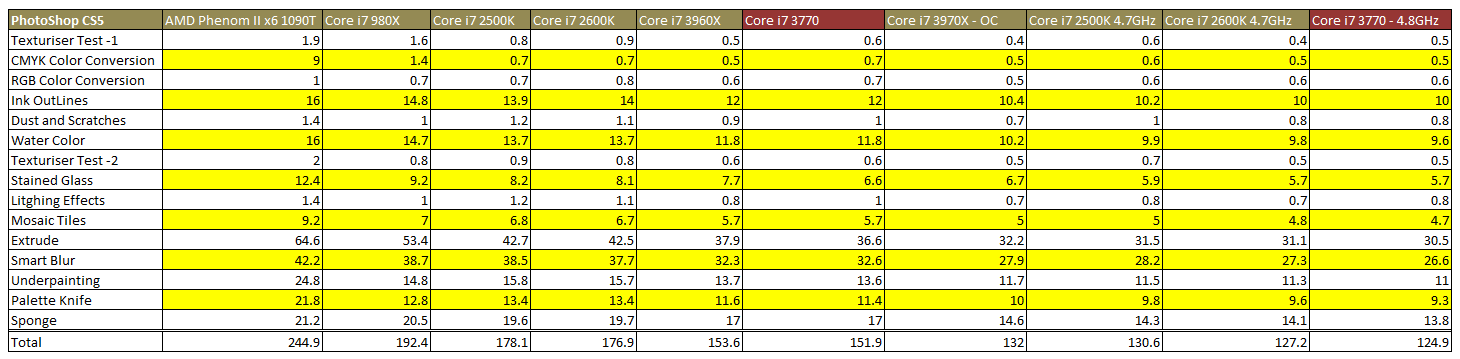
Here we see the AVX extension combined with the improved caching coming back into play as the 3770K does a great job of working through even some of the more complex filters in Photoshop CS5. We are very impressed with this performance considering that it is outperforming the Core i7 3960 which has more than twice the memory bandwidth and more threads
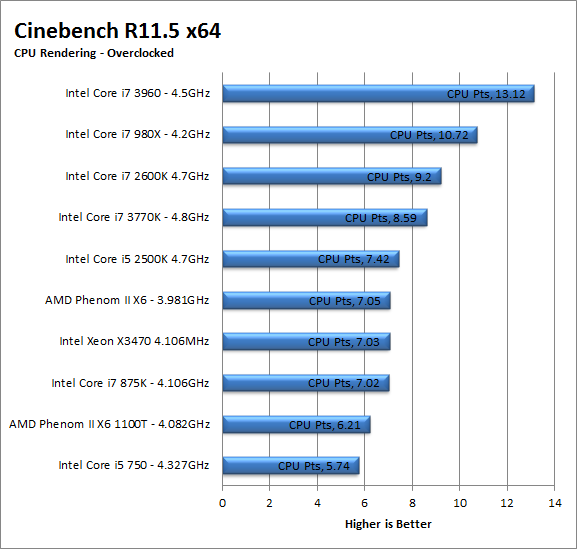
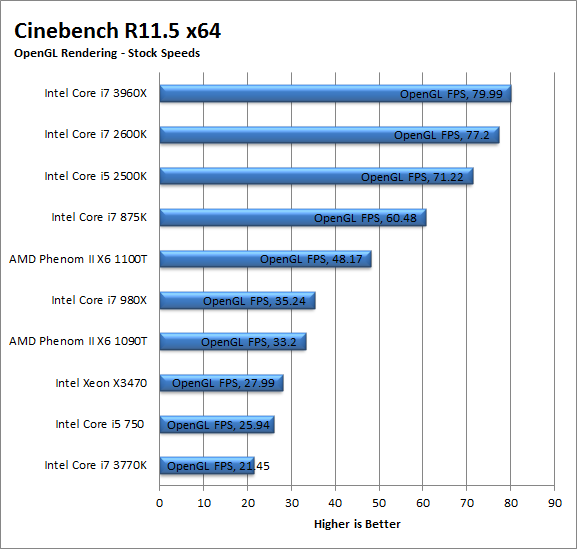
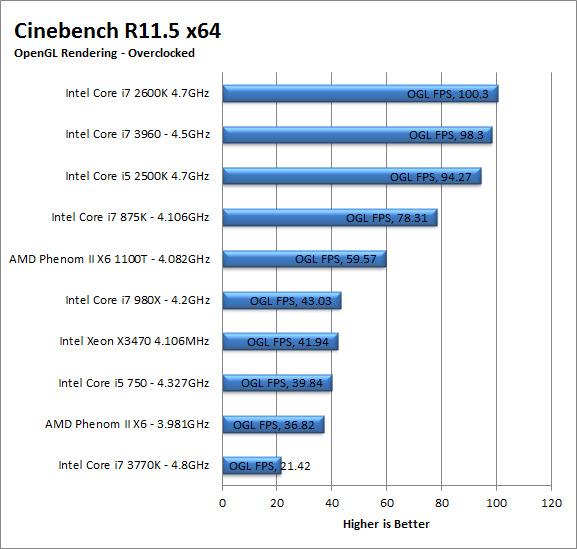
Cinebench R11.5 -
Cinebench R11.5 is the 11th release of Maxon’s rendering test. This test is based off of the Cinema 4D engine, which is one of the industry standard tools for digital animation. It is a powerful product with many different modules that can be “plugged” into it to increase its effectiveness. With Cinebench you get to see how your computer would do using this application. There are two tests; one tests the CPU’s ability to render an image across multiple cores or threads. The other tests your systems ability to handle OpenGL based rendering.
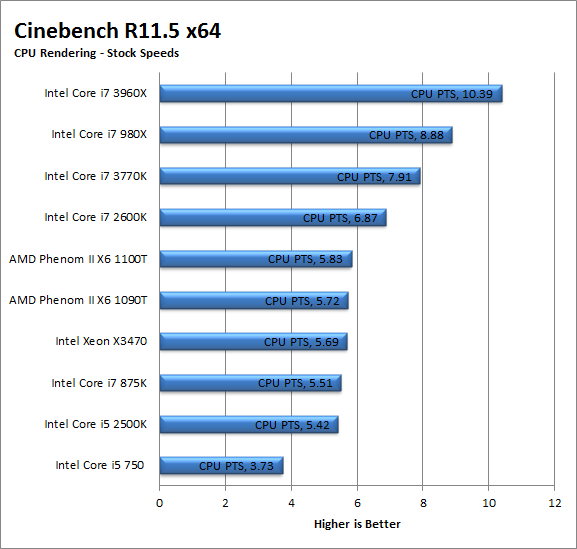
Cinebench R11.5 is another test that Ivy Bridge excels at. Although not as fast as the 980x or the 3960 with their 12 threads (here more threads is king) it is still much faster than its older brother the Core i7 2600K at least at stock speeds.
| Cinebench R11.5 OpenGL Stock | Cinebench R11.5 OpenGL Overclocked |
 |
 |