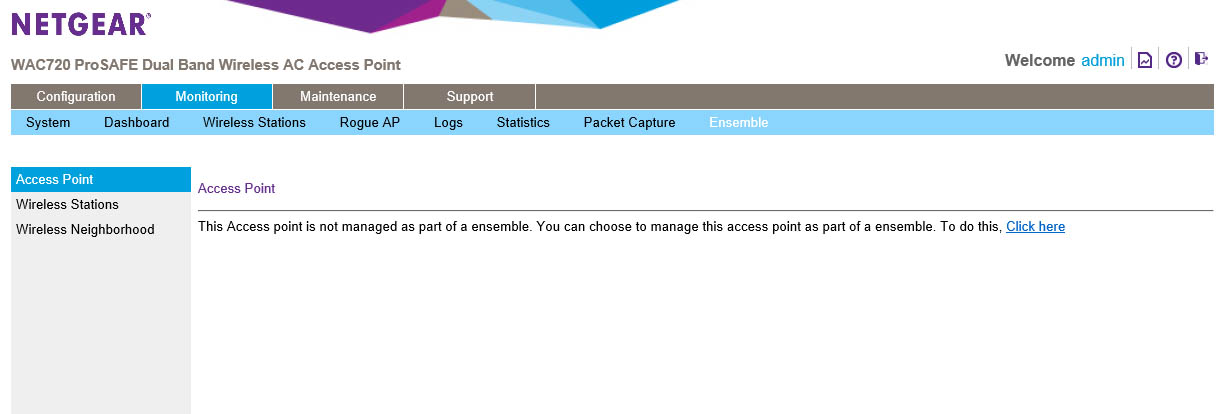
The WebUI, Monitoring -
Connecting the WAP720 to your network is fairly simple as these APs support DHCP. You plug them into a PoE switch (making sure that the port is configured on a VLan that points to the DHCP server you want to use) and it will power on and get an IP. Now after that NETGEAR typically has a tool that will find the APs or switches by MAC address. Unfortunately the WAPs that we received did not have this, but that really did not matter as the DHCP pool we used was built specifically for this test. As soon as we saw the two new IPs we could connect and get started.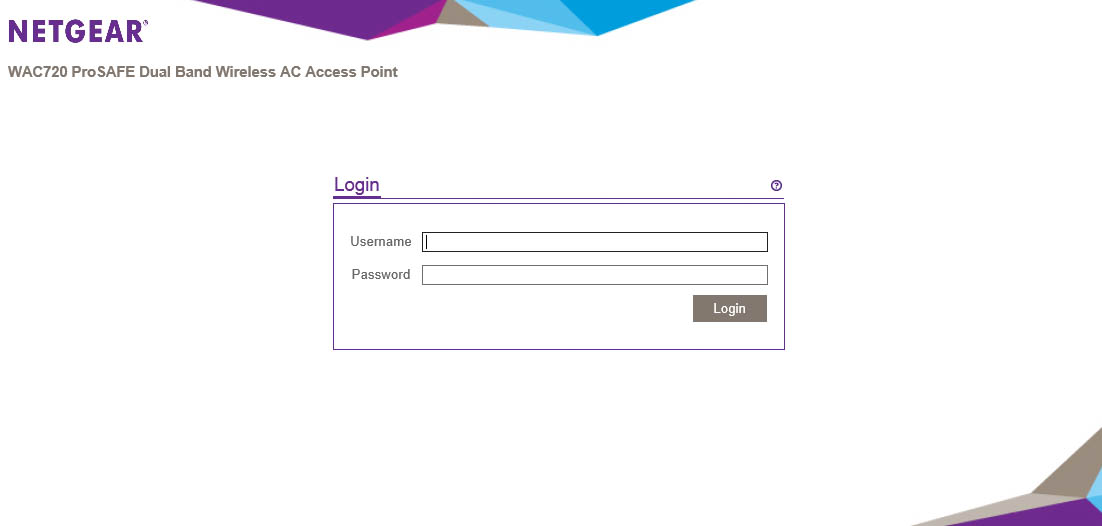
To connect to the WAP you just type in the IP address of the WAP in your browser of choice. This will present you with a login prompt.
 |
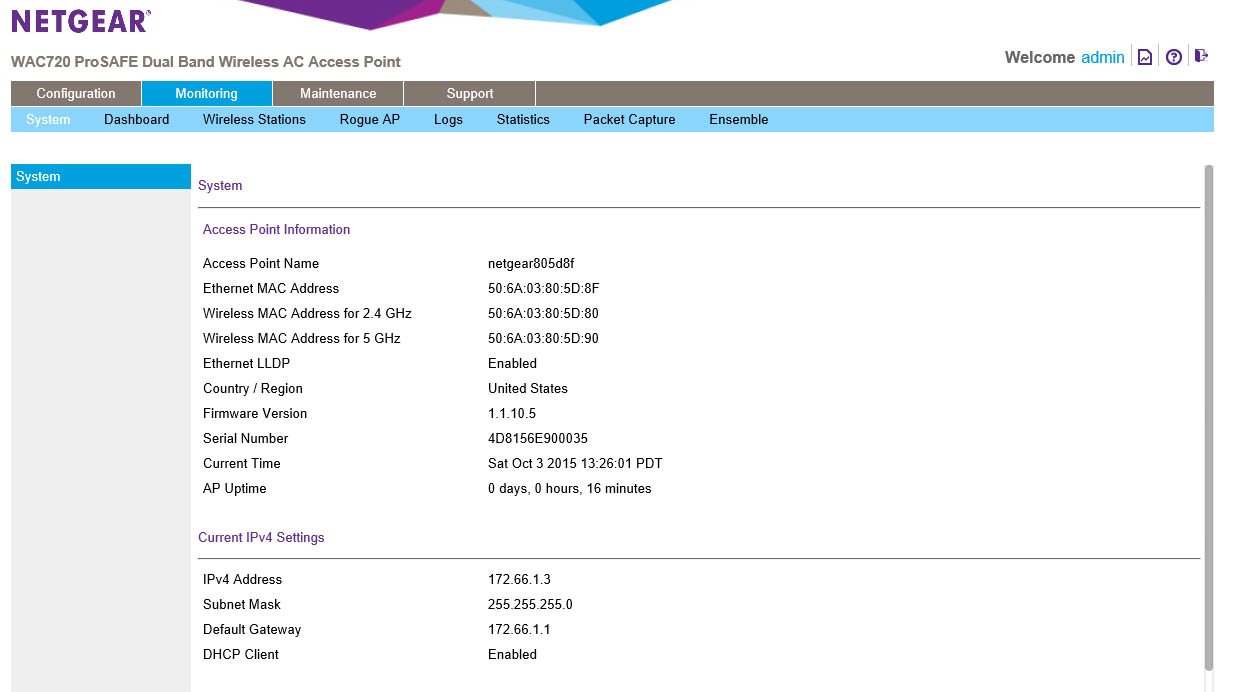 |
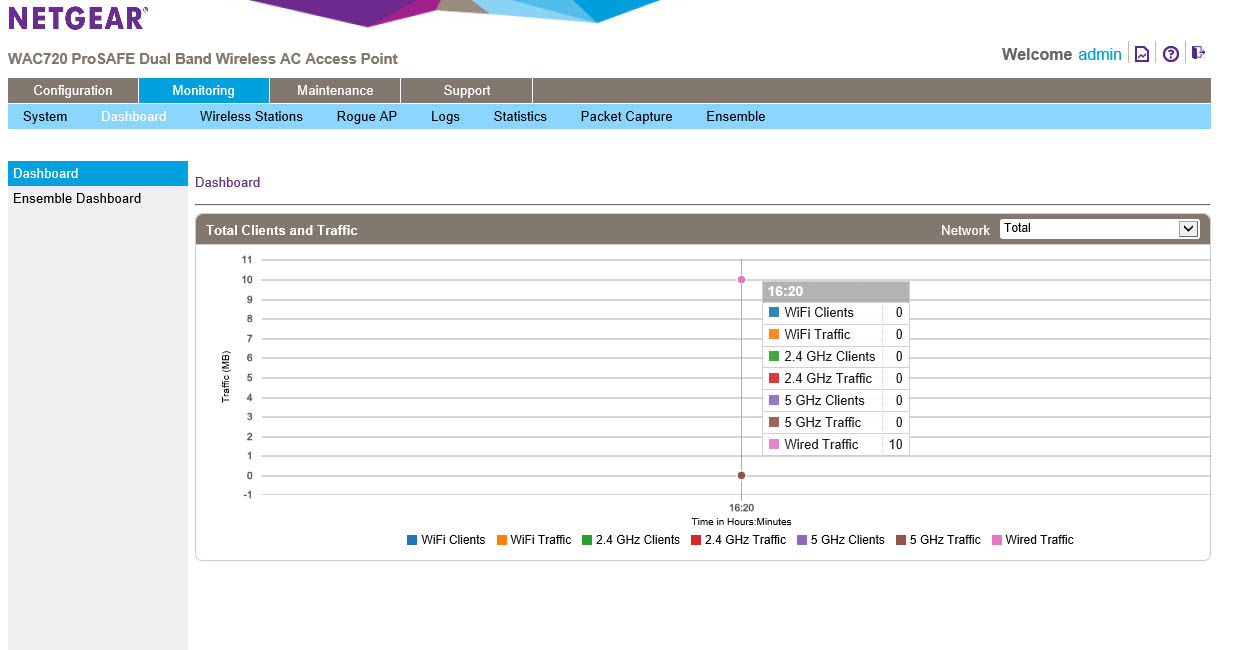
After you type in your user name you are dropped in on the dashboard. Under the dashboard you have two options. You can view the individual WAP or you can dive into the Ensemble dashboard that lets you see what is going on with all of the WAPs in a group. Here you can see the number of clients connected to and the amount of traffic for each type of wireless you offer. There is even a handy little legend that lets you know which is which. Moving back to the left we find the system information. The data here is very self-explanatory.
 |
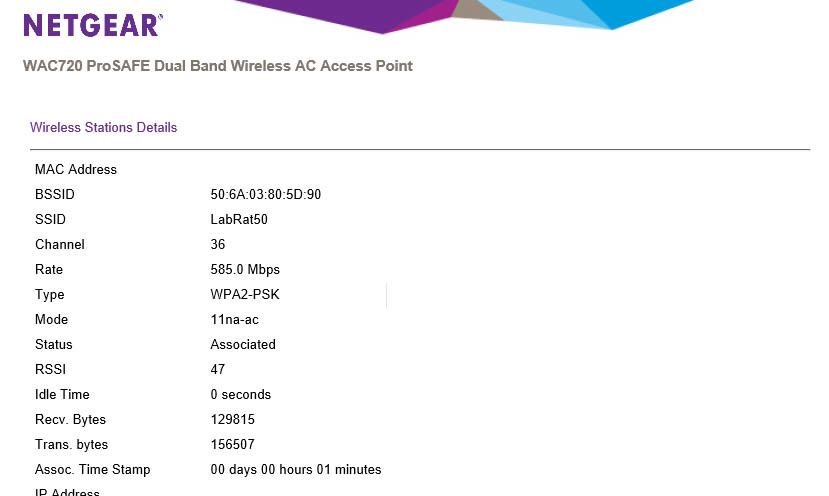 |
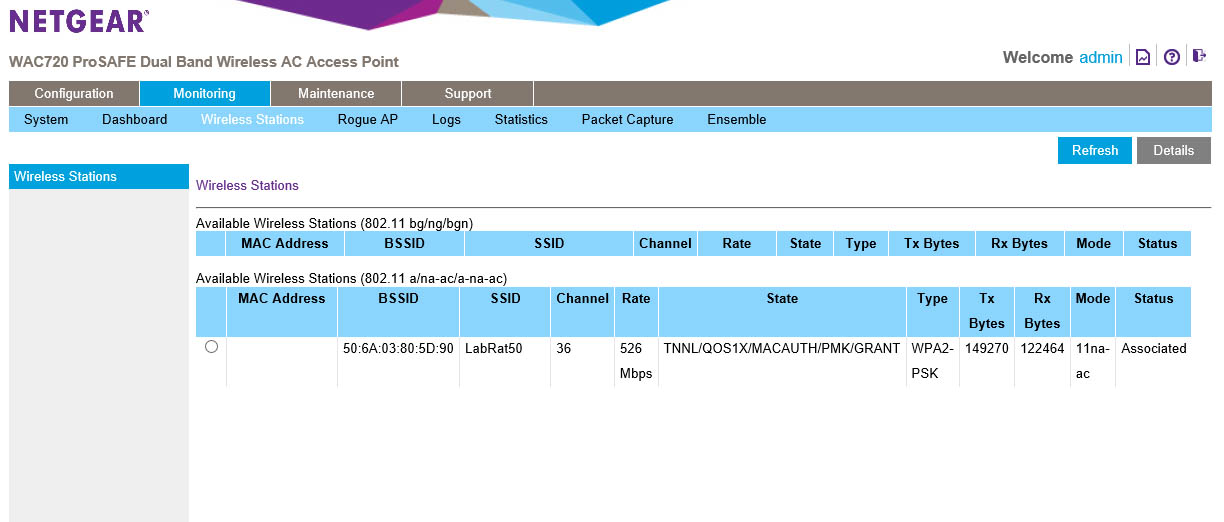
Taking a jump from the system screen to the Wireless Stations link you will find all of the information on active SSIDs. If someone is connected to an SSID you will see if listed as “associated” with a particular device. You will be able to see the MAC Address of the device, but not the IP. This later is a little disappointing as you can see that in the details for a client, but it would have been nice to have it here in the group listing. You do get a list of all of the services available on the SSID listed in the state area. If you click on a client and chose details you get more information about that client, including the IP address that it is using.
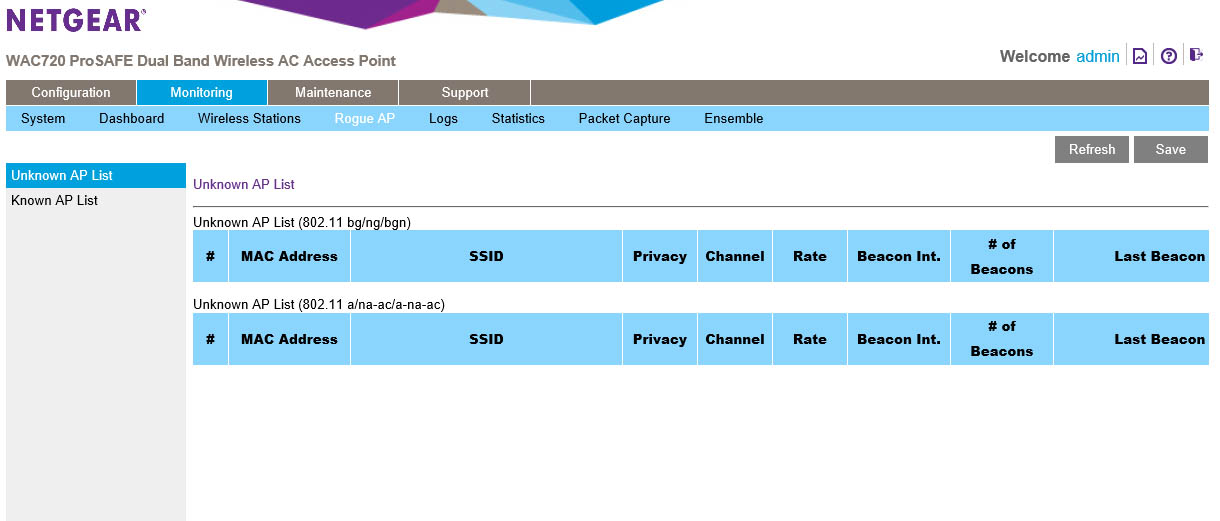
The Rouge AP link does just what it says. When you when enable rouge AP detection this screen will show any broadcasting APs (SSIDs). You can look at the list in two forms; known and unknown. You can guess what these mean.
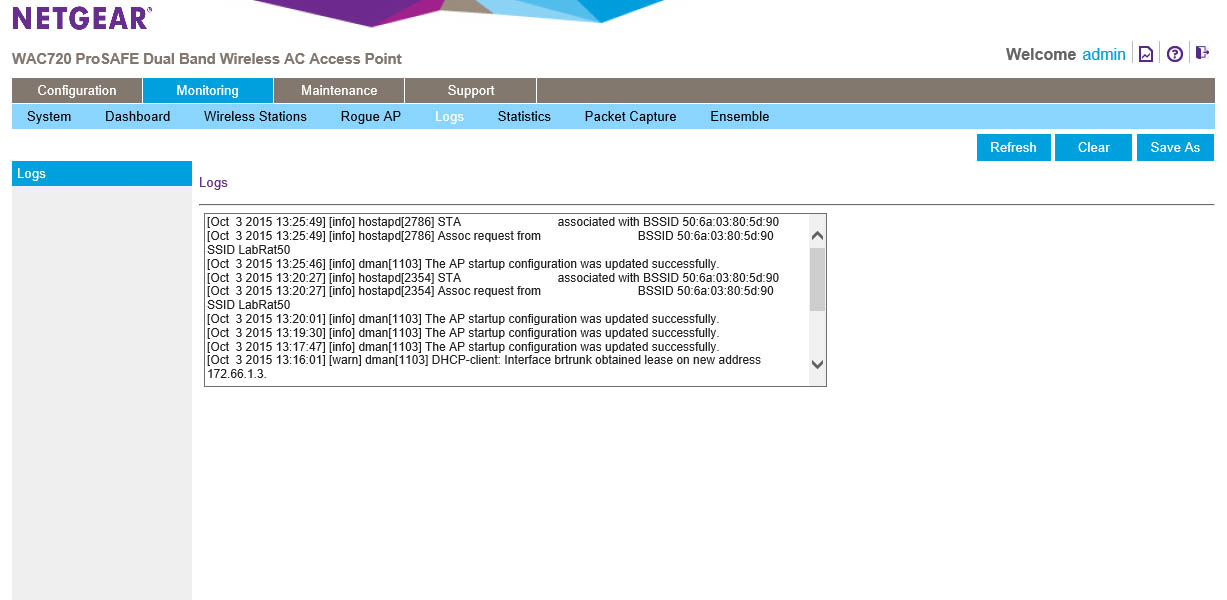
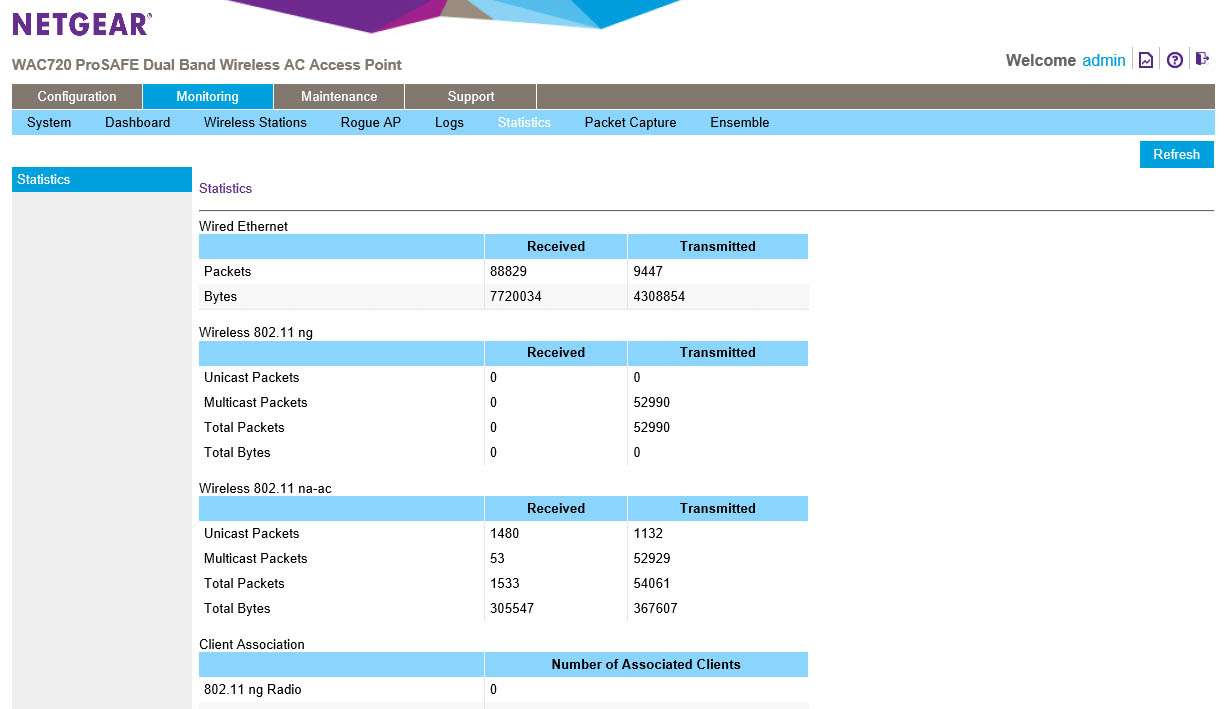
Logs and Statistics… you can guess what those show. If not we included some pictures for you.
 |
 |
NETGEAR also threw in the ability to run a packet capture on the network. This is just in case you want to see what might be happening on your network. You can chose the interface you want to capture the traffic on and also put it in promiscuous mode (which means it will talk to anyone). To make things a little more clear you can also filter by a client MAC address.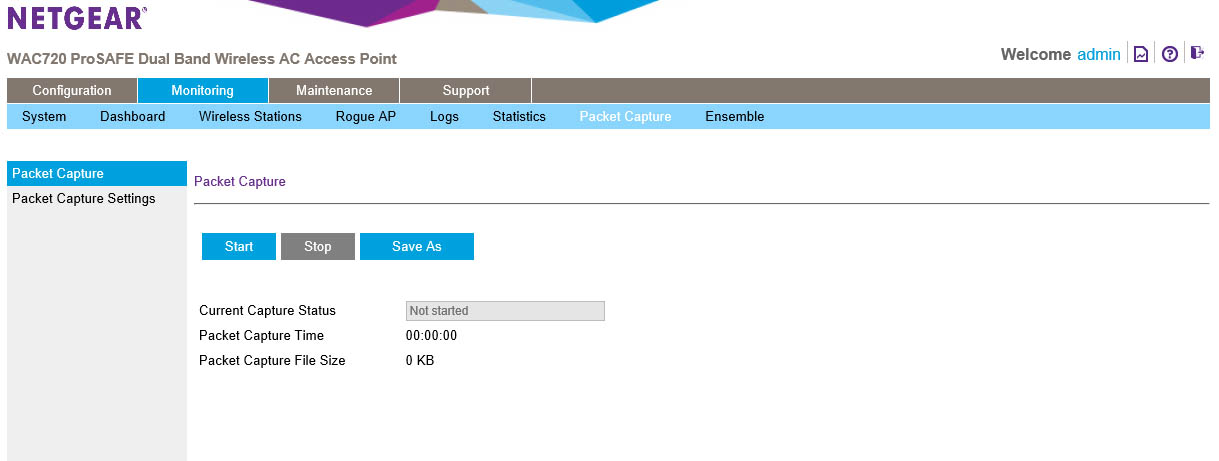
We will talk about ensemble monitoring later after we walk you through how to set up an ensemble group.